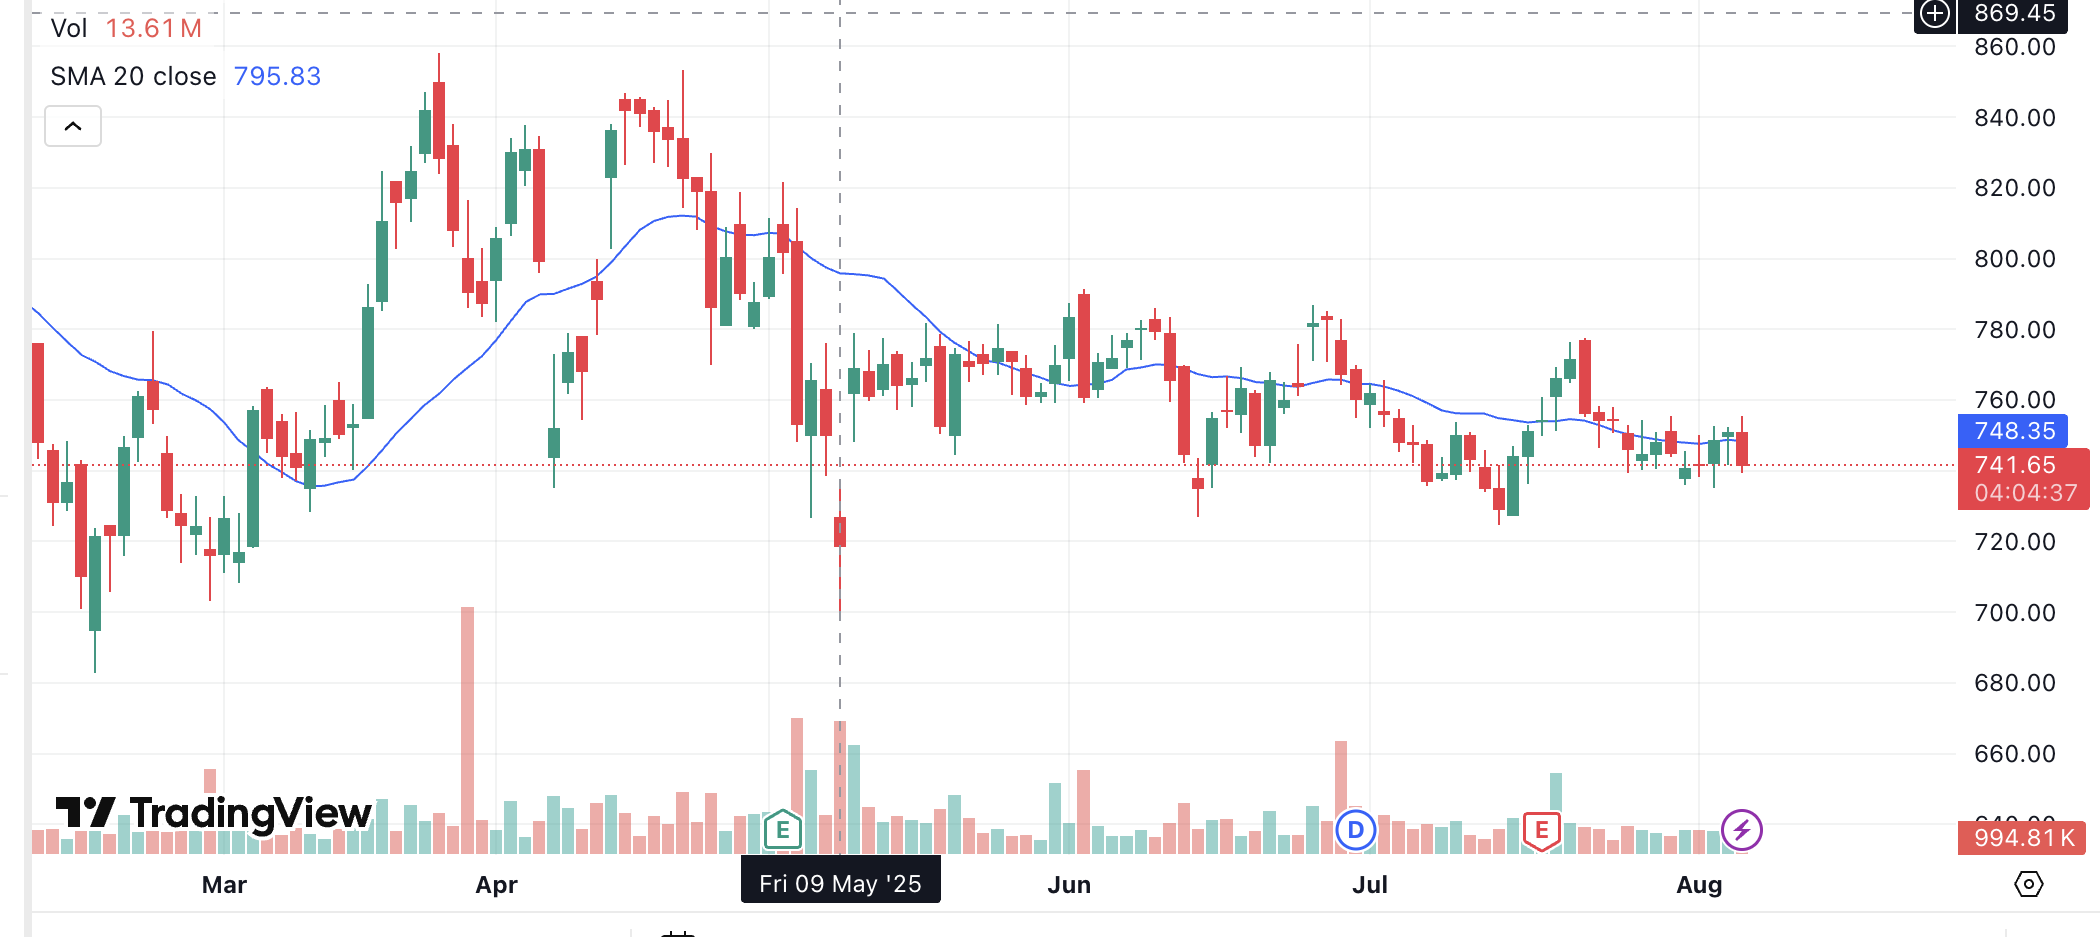
In Stock market trading, many people use technical indicators to understand price movement and take better decisions. One of the most popular indicators is the Exponential Moving Average (EMA). It helps traders to find the trend of a stock or any asset. EMA is a type of moving average that gives more importance to recent prices. This means it reacts faster to new price changes compared to the Simple Moving Average (SMA).
The basic formula of EMA is a little complex, but the main idea is to reduce the impact of old prices and give more weight to the latest ones. Many traders use EMA to find buying or selling signals. For example, when a short-term EMA (like 9-day) crosses above a long-term EMA (like 21-day), it is considered a buy signal. And when it goes below, it is a sell signal.
EMA is also useful in intraday and swing trading to understand support and resistance levels. Whether you are a beginner or experienced trader, learning EMA can really help you improve your trading strategy. It is available on all charting platforms like TradingView, Zerodha Kite, and more. So next time you check stock charts, try using EMA and see how it shows the trend clearly.
Overview of Contents
📝 Easy Understanding of EMA (Exponential Moving Average)
Exponential Moving Average, or EMA, is a type of moving average that gives more importance to recent prices, so it reacts faster to market changes compared to Simple Moving Average (SMA). This helps traders to catch short-term trends quickly.
The EMA formula uses a special multiplier that gives extra weight to new price data, making it useful for finding the current direction of the market.
Traders usually use 12-day and 26-day EMAs for short-term analysis, and 50-day or 200-day EMAs for long-term trend checking. However, because EMA changes quickly with price, it can also give false signals sometimes.
That’s why many traders use EMA with other indicators like RSI or MACD to confirm trends. One more thing to remember is that EMA is based only on past prices, and some people believe that past data cannot always predict future market movement correctly. So while EMA is a helpful tool, it should be used wisely along with other analysis methods.

Formula of EMA (Simple Explanation)
The formula of EMA may look difficult, but we will break it into simple steps:
EMA (Today) = (Closing Price Today × Multiplier) + (EMA Yesterday × (1 − Multiplier))
Where:
- Multiplier = 2 / (Number of Days + 1)
- EMA Yesterday is the previous day’s EMA value.
👉 Example:
If you want to calculate a 10-day EMA, then: Multiplier = 2 / (10 + 1) = 0.1818 (or 18.18%)
So, today’s EMA = (Today’s closing price × 0.1818) + (Yesterday’s EMA × 0.8182)
To start the calculation, first you need the Simple Moving Average (SMA) of the initial period (like first 10 or 20 days). This SMA becomes the first EMA value.
📊 Popular EMA Time Periods in Trading
Traders use different timeframes of EMA based on their strategy:
- Short-Term EMA: 9-day, 12-day, or 20-day – mostly used by intraday and swing traders.
- Medium-Term EMA: 26-day or 50-day – used for identifying medium trends.
- Long-Term EMA: 100-day or 200-day – used by long-term investors to track the big trend.
How to Use EMA in Trading?
1. Trend Identification
If the EMA is going up, it means the market is in an uptrend. If it is going down, the market is in a downtrend.
2. Buy/Sell Signals (EMA Crossovers)
A common trading strategy is EMA crossover.
- When a short-term EMA (like 9-day) crosses above a long-term EMA (like 21-day), it gives a buy signal.
- When it crosses below, it gives a sell signal.
3. Support and Resistance
- In an uptrend, EMA often acts like support – traders buy when price touches the EMA.
- In a downtrend, EMA acts like resistance – traders sell near the EMA line.
🔁 EMA vs SMA – What’s the Difference?
| Feature | EMA | SMA |
|---|---|---|
| Weight to Prices | More weight to recent prices | Equal weight to all prices |
| Speed | Reacts faster to price change | Slower |
| Lag | Less lag | More lag |
| Usage | Preferred for short-term trading | Preferred for longer-term view |
EMA is better when you want quick signals, but SMA is more stable and slow-moving.
Limitations of EMA
Even though EMA is very useful, it has some drawbacks:
- False Signals: In sideways markets, EMA can give wrong buy/sell signals.
- Depends on Past Data Only: EMA works only on historical prices, not on future predictions.
- May Misguide Without Confirmation: Using EMA alone is risky. It’s best to use it with other tools like RSI, MACD, or Volume indicators.
Practical Tips for Using EMA
- Combine EMAs: Use two EMAs (short + long) for better clarity.
- Use EMA with Price Action: Don’t blindly follow crossovers. Check how price behaves around the EMA.
- Backtest Strategies: Always test your EMA strategy on old data before using in live trading.
Real-Life Example of EMA in Action
Suppose you are checking a stock chart, and you plot 50-day EMA. If the stock price is above the 50-day EMA and EMA is going up, then the stock is in a strong uptrend. You may plan a buy near the EMA if price takes support. But if price falls below the EMA and the EMA is turning down, it may be a sign of weakness.
💹 Common EMA Trading Strategies
You can include some popular EMA-based strategies:
✅ EMA + RSI Strategy
- Use EMA to find trend.
- Use RSI (Relative Strength Index) to avoid overbought/oversold traps.
- For example: Buy when EMA shows uptrend & RSI is below 30.
✅ EMA Pullback Strategy
- Wait for the price to move above the EMA.
- Enter on pullback (price comes down near EMA and bounces back).
- Ideal for trend-following traders.
✅ EMA + MACD Strategy
- Use EMA to determine the trend.
- Use MACD for entry/exit.
- Works great for swing trading.
Deep Dive into EMA Crossovers
Go deeper into EMA crossover strategies:
1. Golden Cross (Bullish Signal)
When 50-day EMA crosses above 200-day EMA, it’s called a Golden Cross. It signals a long-term uptrend.
2. Death Cross (Bearish Signal)
When 50-day EMA crosses below 200-day EMA, it’s called a Death Cross, suggesting a strong downtrend.
📌 These signals are widely followed by investors and often move markets.
Types of Moving Averages and Where EMA Fits
To help readers understand EMA better, explain how it compares to other moving averages:
- SMA (Simple Moving Average): Equal weight to all data points.
- WMA (Weighted Moving Average): Gives more weight to recent prices, but not exponentially.
- EMA (Exponential Moving Average): More reactive to recent price changes.
Best Timeframes to Use EMA
| Trading Style | EMA Period | Timeframe Used |
|---|---|---|
| Intraday | 9 EMA, 21 EMA | 5 min, 15 min charts |
| Swing Trading | 20 EMA, 50 EMA | 1 hour, 4 hour charts |
| Long-term | 100 EMA, 200 EMA | Daily or Weekly charts |
Final Thoughts
Exponential Moving Average (EMA) is a powerful and flexible tool used by traders to understand price trends and take better trading decisions. It gives more importance to recent data, which helps in quick reactions. But always remember, EMA should be used along with other indicators and price action to avoid false signals. Whether you are a beginner or experienced trader, learning how EMA works can surely improve your market understanding.

