The share price of Glenmark Pharmaceuticals, like any other pharmaceutical company, is primarily influenced by factors such as regulatory approvals, market performance, and financial results. Significant news regarding the approval of drugs, especially in large markets like the U.S. or Europe, can lead to price volatility. For example, successful clinical trials and FDA approvals for new drugs may lead to a surge in share prices due to the potential for increased revenue streams.
Conversely, regulatory setbacks, such as delays or rejections in drug approvals, can negatively impact the company’s stock price. Financial performance, including revenue growth from key products, profit margins, and cost management, also plays a crucial role in shaping investor sentiment. Moreover, broader market conditions, industry trends, and competitive pressures within the pharmaceutical sector can influence Glenmark’s stock performance. External factors like changes in healthcare policies, pricing regulations, and currency exchange rates, particularly as Glenmark operates internationally, can further affect the company’s financial outlook and stock price.
Understanding the Time Frames and CAGR for Gleenmark Pharma Share
10 Years (2014-2024, CAGR: 6%)
- Over the last decade, the stock price has grown at a modest rate of 6% annually.
- This indicates steady but slow growth, suggesting the company experienced stable performance during this period, with no rapid price surges or declines.
5 Years (2019-2024, CAGR: 36%)
- In the last five years, the stock price has grown significantly faster at 36% annually.
- This sharp increase may point to strong earnings, successful business initiatives, or favorable market conditions for the company starting around 2019.
3 Years (2021-2024, CAGR: 45%)
- In the more recent three years, the stock price growth accelerated further to 45% annually.
- This higher growth rate likely reflects a period of extraordinary performance, possibly due to specific events such as the launch of successful products, increased market demand, or industry-wide tailwinds.
1 Year (2023-2024, CAGR: 93%)
- The last year has been exceptional, with a staggering growth rate of 93% annually, nearly doubling the stock price in this short period.
- Such growth could be attributed to breakthrough developments like strong quarterly results, positive investor sentiment, or market speculation.
Key Takeaways
- Early Years (2014–2019): The company had slower growth during this period, reflected by the lower 10-year CAGR of 6%.
- Growth Acceleration (2019–2024): From 2019 onwards, growth picked up significantly, with a 5-year CAGR of 36%.
- Peak Momentum (2023–2024): The company achieved its fastest growth over the past year, with a 93% CAGR, possibly due to extraordinary circumstances like market overreaction or significant fundamental improvements.
Glenmark Pharmaceuticals Ltd Share Target Price 2024 To 2030 (CAGR 12%, 15%, 18%, 20%, 25%)
| Year | 6% CAGR | 36% CAGR | 45% CAGR | 93% CAGR | 12% CAGR | 15% CAGR | 18% CAGR | 20% CAGR | 25% CAGR |
| 2024 | ₹1,550 | ₹1,550 | ₹1,550 | ₹1,550 | ₹1,550 | ₹1,550 | ₹1,550 | ₹1,550 | ₹1,550 |
| 2025 | ₹1,643 | ₹2,108 | ₹2,247 | ₹2,994 | ₹1,736 | ₹1,783 | ₹1,829 | ₹1,860 | ₹1,938 |
| 2026 | ₹1,742 | ₹2,868 | ₹3,259 | ₹5,785 | ₹1,945 | ₹2,051 | ₹2,158 | ₹2,232 | ₹2,422 |
| 2027 | ₹1,847 | ₹3,903 | ₹4,724 | ₹11,177 | ₹2,179 | ₹2,359 | ₹2,548 | ₹2,678 | ₹3,028 |
| 2028 | ₹1,958 | ₹5,312 | ₹6,844 | ₹21,597 | ₹2,442 | ₹2,712 | ₹3,007 | ₹3,213 | ₹3,785 |
| 2029 | ₹2,075 | ₹7,229 | ₹9,917 | ₹41,711 | ₹2,737 | ₹3,119 | ₹3,548 | ₹3,856 | ₹4,732 |
| 2030 | ₹2,200 | ₹9,838 | ₹14,371 | ₹80,586 | ₹3,065 | ₹3,587 | ₹4,186 | ₹4,627 | ₹5,915 |
Technical Analysis

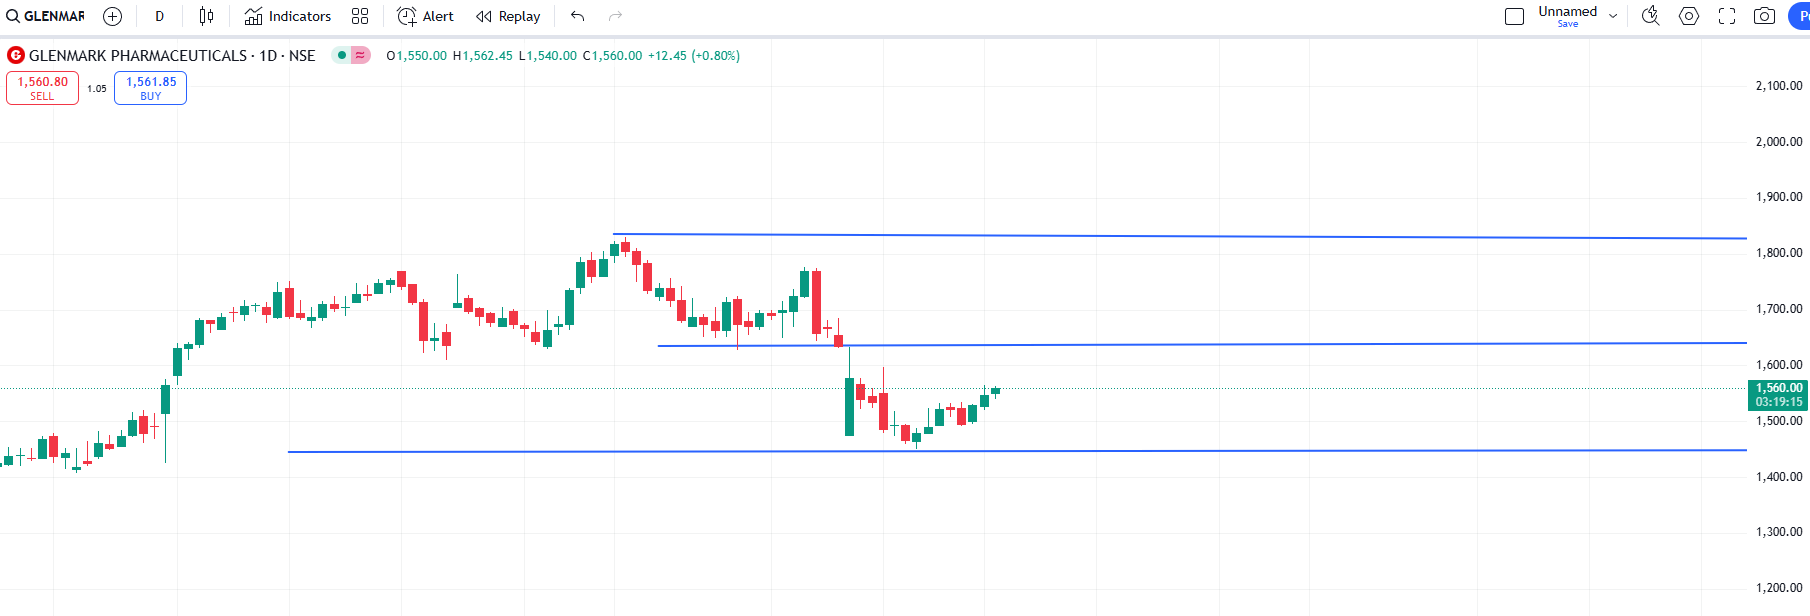
- First Support Level: The stock finds strong support at ₹1454, as observed on 25th November 2024. This level has acted as a crucial floor for the price, providing stability and preventing further downside.
- Nearest Resistance Level: The stock faces immediate resistance at ₹1630. This level is pivotal in determining the next price movement. A successful breakout above this level, accompanied by strong volumes, could signal the start of a bullish phase.
All-Time High
- The stock’s all-time high is ₹1830.95, which remains a significant psychological and technical barrier. A decisive close above this level could propel the stock into uncharted territory, signaling a strong uptrend.
Bullish Scenarios
- If the stock breaks above ₹1630 and sustains this level, it could gather momentum to test its all-time high of ₹1830.95.
- A breakout beyond ₹1830 would indicate a new high, with the potential for the stock to rally further, supported by bullish market sentiment and strong buying interest.
Bearish Scenarios
- If the stock fails to hold the ₹1454 support level, it may experience further downward pressure, testing lower support levels.
Key Indicators to Watch
- Volume: A breakout above ₹1630 should ideally be accompanied by increased trading volumes, confirming the strength of the move.
- RSI (Relative Strength Index): Monitor RSI levels to ensure the stock is not entering overbought territory near resistance levels.
- Moving Averages: Check if the stock is trading above its 50-day and 200-day moving averages, as this signals overall bullishness.
Glenmark Pharma Ltd. is at a critical juncture with strong support at ₹1454 and immediate resistance at ₹1630. A breakout above ₹1630 could pave the way for retesting its all-time high of ₹1830. Investors and traders should watch for confirmation signals such as volume and momentum indicators to gauge the stock’s potential movement.
Conclusion
In conclusion, Glenmark Pharma’s stock shows strong growth potential with projected target prices ranging from ₹1736 to ₹7390 by 2030, depending on the CAGR scenario. With a solid support at ₹1454 and resistance at ₹1630, a breakout above this level could propel the stock towards new highs, including the all-time high of ₹1830. Investors should watch key technical levels and growth trends to assess the stock’s future performance, which remains promising for long-term investment.


